|
| Andy Tattersall |
In recent years there has been huge, rapid growth in the number of online platforms and tools made available to academics carrying out their research activities. However, for many, such choice can lead to decision fatigue or uncertainty as to what is most appropriate. Andy Tattersall reflects on the success of Discogs and IMDB and considers what problems a similar site dedicated to academic research might help to solve; from version control and unique identifiers to multiple, diverse research outputs and improved interactions with data.
Academia can always learn a lot from the rest of the world when it comes to working with the web. The project
101 Innovations in Scholarly Communications is a superb case study, highlighting the rapid growth in academic and associated web platforms. As a result there is an increasing problem for academics when they come to choose their platform or tool for carrying out their work on the web. Choice is good, but too much can lead to
decision fatigue and anxiety over having to adapt to more and more new tools and make decisions as to their value. In the last decade various organisations, academics and start-ups have noticed gaps in the market and created tools and websites to help organise and communicate the work of academics. This is now arguably having the negative effect of researchers not knowing where to invest their time and energy in communicating, sharing and hosting their work, as no one can use every platform available. Even by linking many of them there are still issues around their maintenance and use.
In hindsight, academia could have learned from two successes of the internet era.
Discogs and the
Internet Movie Database (IMDB) are two of the most popular websites on the planet. Each is authoritative and seen as the ‘go to’ platforms for millions of users interested in music and film respectively. IMDB is ranked at #40 and Discogs at #799 in
Alexa, a global internet ranking index of websites. IMDB was one of the original internet sites launched in 1990, with Discogs arriving a decade later in 2000. Whilst there are other similar websites, there are few that even come close to their user numbers and the huge amount of specialised content they host. By contrast, academia has tried desperately to place large swathes of information under umbrellas of knowledge, but it all feels a bit too much like herding cats.
Image credit: Tangled Weave by Gabriel. This work is licensed under a CC BY 2.0 license.
Academia has always made use of the web to have discussions, host research and institutional websites but has failed to control the number of newer platforms that promise to be an essential tool for academics. Over the last decade – and notably in the last five years – hundreds of tools that aim to enhance a researcher’s workflow, visibility and networks have been created. Many of these do indeed offer a service:
Figshare hosts research outputs;
Mendeley manages references; and
Altmetric.com tracks attention. They are all superb and offer something befitting academia in the 21st century. The problem for many academics is that they struggle to engage with these tools due to the overwhelming number to choose from. If you want to manage references, do you use
Endnote, Mendeley,
Zotero,
RefMe,
ReadCube or
Paperpile? If you wish to extend your research network do you sign up for
ResearchGate,
Google Scholar,
Academia.edu,
Piirus,
LinkedIn or even
Facebook? This is before we tap into the more niche academic social networks. Then there is the problem of visibility; how do you make sure your fellow academics, the media, fund holders or even members of the public can find you and your work?
ORCiD obviously solves some of this, but it can be seen as a chore and another profile that needs configuring and connecting.
As research in the 21st century continues on its current trajectory towards openness and impact, and as scholarly communications develop, there will no doubt be yet more tools and platforms to deal with all that content and communication. If we think about making data accessible and reusable, post-publication open peer review, as well as making other research outputs available online, we may see a more tangled web than ever before.
What Discogs could teach us
Like so many of the post-Web 2.0 academic interactive platforms, content is driven by the users, those being academics and supporting professionals. Of course, a large number of formal research platforms have remained as they were, hosted by institutions, research bodies, funders and publishers. Yet more and more research outputs are being deposited elsewhere such as GitHub (which has a comparable internet ranking to IMDB), Figshare, Slideshare, ResearchGate and Google Drive, to give just a few examples.
How can we compare the research world with Discogs?
In my mind Discogs is not too dissimilar to the research world and all of its outputs. Listed below are some of the similarities between them. Those who have used Discogs will hopefully make the connection quicker than those who have not.
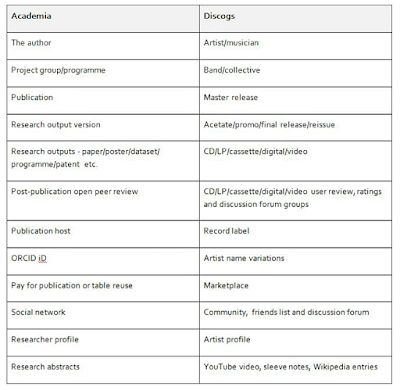 |
| A comparison of academia and Discogs |
IMDB and Discogs can be searched in various different ways, all of which allow a person to drill deeper into an area of the database or move around serendipitously using the hyperlinks. So with Discogs you may know the title of a song but not the artist, or you may know what label it was released on. You may also be keen to track down a particular version of a release based on geographical, chronological or label data. The search functions of Discogs may not be as complex as a research database such as Medline, but for the typical Discogs user this is not essential.
What are the big problems a Discogs or IMDB-type site could solve?
Version control
With growing interest in academic publishing platforms that capture the various stages of publishing research, there is a problem of ensuring those searching for that research find the version they really want. We have the final, peer reviewed, accepted and formatted version; the report the paper may have contributed to; the pre-print; the early draft; the research proposal; and the embryonic research idea. Research platforms such as ROI aim to capture as much of this research process as possible.
Unique identity
ORCiD is a great tool for aligning the work of one person to their true identity (especially so for early career researchers or academics who change their name mid-career, for example). You do not have to have the common surnames of Smith, Brown, Taylor or Jones to be mistaken for another researcher, less common-named academics also have this problem. If a researcher publishes using their middle initial and then without, it can create multiple identities in some databases and tying them all together is not always straightforward and can be time consuming. In Discogs, an artist or band is listed with all name variations collected under the most commonly used title. ORCiD allows this, but sadly the problem is already very extensive.
Additional research outputs
The mainstay of academic output is the journal paper but that is not the case for some areas of research. There are artistic performances, computer code, software, patents, datasets, posters, conference proceedings, and books, among others. Some stand alone, whilst there are increasing numbers of satellite outputs tied to one piece of research. For example, in Discogs we might think of the LP album as the definitive item and of the single, EP or digital release as outputs resulting from that. For research this may be the report or journal paper with attached outputs including a poster, dataset and conference presentation.
Interaction with the research data
Each of Discogs and IMDB allows users to interact with its huge database of information. Users can set up accounts, add music and films to their personal collections, leave reviews and contribute knowledge. To flip that into an academic context, that might mean users saving research artefacts to a reference management package, leaving open peer review comments and contributing their own insights and useful resources.
Such a platform would not operate in isolation, as there would still be a need for other connected web presences to exist. Social media, such as Twitter, to communicate to wider audiences; publication platforms to host all of the published research; tools to manage references and track scholarly attention. Other tools would also be needed to help conduct the research, analyse and present results and data, create infographics, take lab notes, collaborate on documents and create presentations. Then there is the issue of who would oversee such a huge database, manage it and ensure it is kept largely up to date. Of course with something similar to Discogs and IMDB anyone could enter and update the content, with proper accreditation, audit trail and moderation. Such a platform would have been accessible to funders, charities and public, with certain limitations on access to certain content. Hindsight is a wonderful thing and given how IMDB and Discogs have grown into such well-known and used platforms it is a shame that the same did not happen in academia to help create such a central hub of knowledge and activity.
Note: This article gives the views of the author, and not the position of the LSE Impact Blog, nor of the London School of Economics. Please review our comments policy if you have any concerns on posting a comment below.
About the author
Andy Tattersall is an Information Specialist at the School of Health and Related Research (ScHARR) and writes, teaches and gives talks about digital academia, technology, scholarly communications, open research, web and information science, apps, altmetrics and social media. In particular, how these are applied to research, teaching, learning, knowledge management and collaboration. Andy is a member of the University of Sheffield’s Teaching Senate and a Senior Fellow of the Higher Education Academy. He was the person who sparked interest in running the first MOOCs at his institution in 2013. Andy is also Secretary for the Chartered Institute of Library and Information Professionals – Multi Media and Information Technology Committee. He has edited a book on Altmetrics for Facet Publishing which is aimed at researchers and librarians. He tweets @Andy_Tattersall and his ORCID ID is 0000-0002-2842-9576.